Photometric Center (배광측정결과 생성)
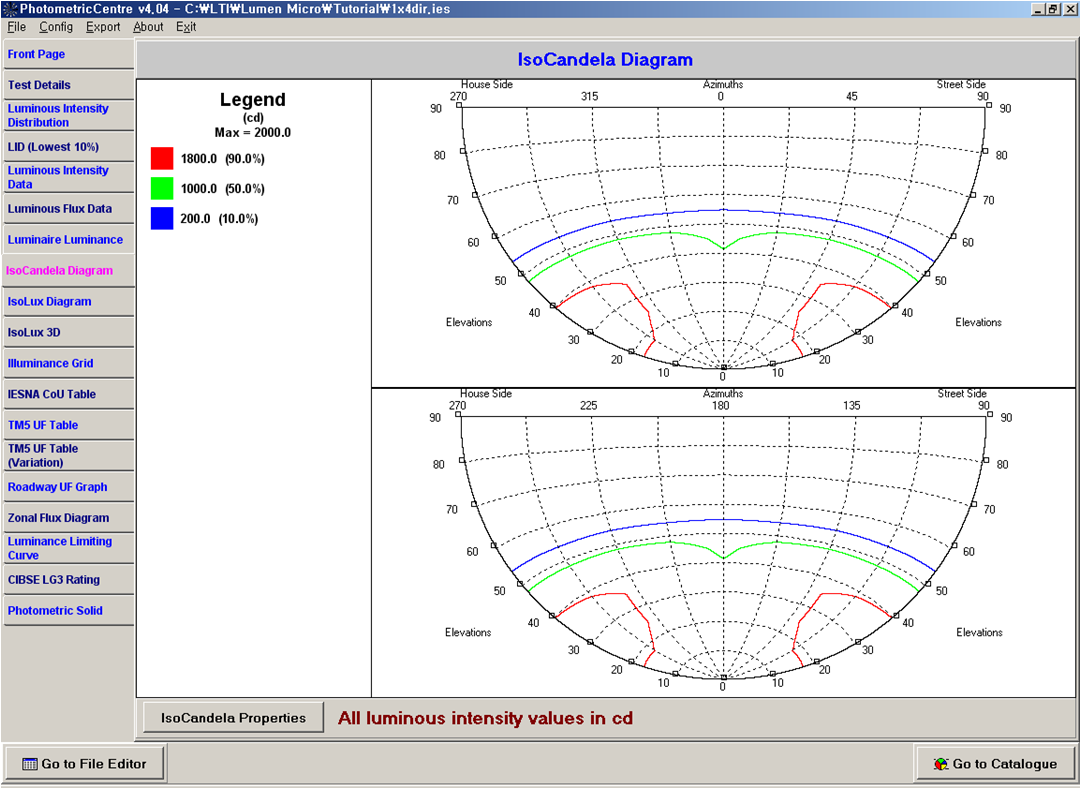
- ISO-Candela Diagram or web (CIE Roadway) Format plotted
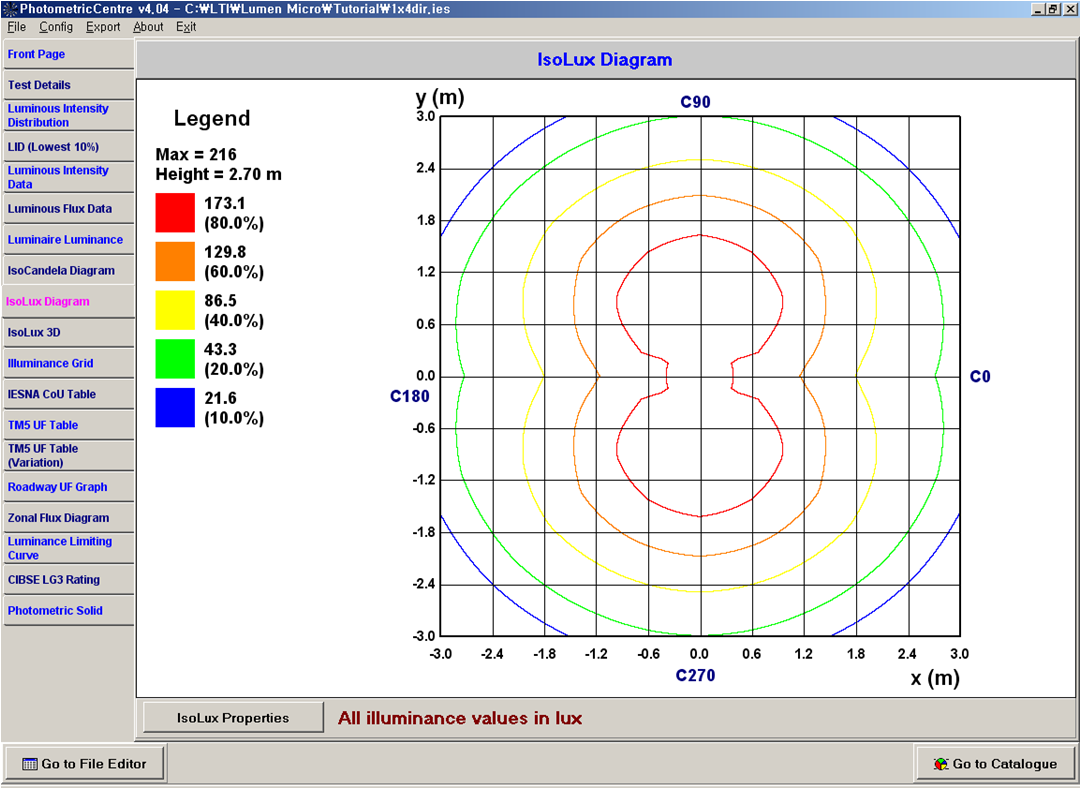
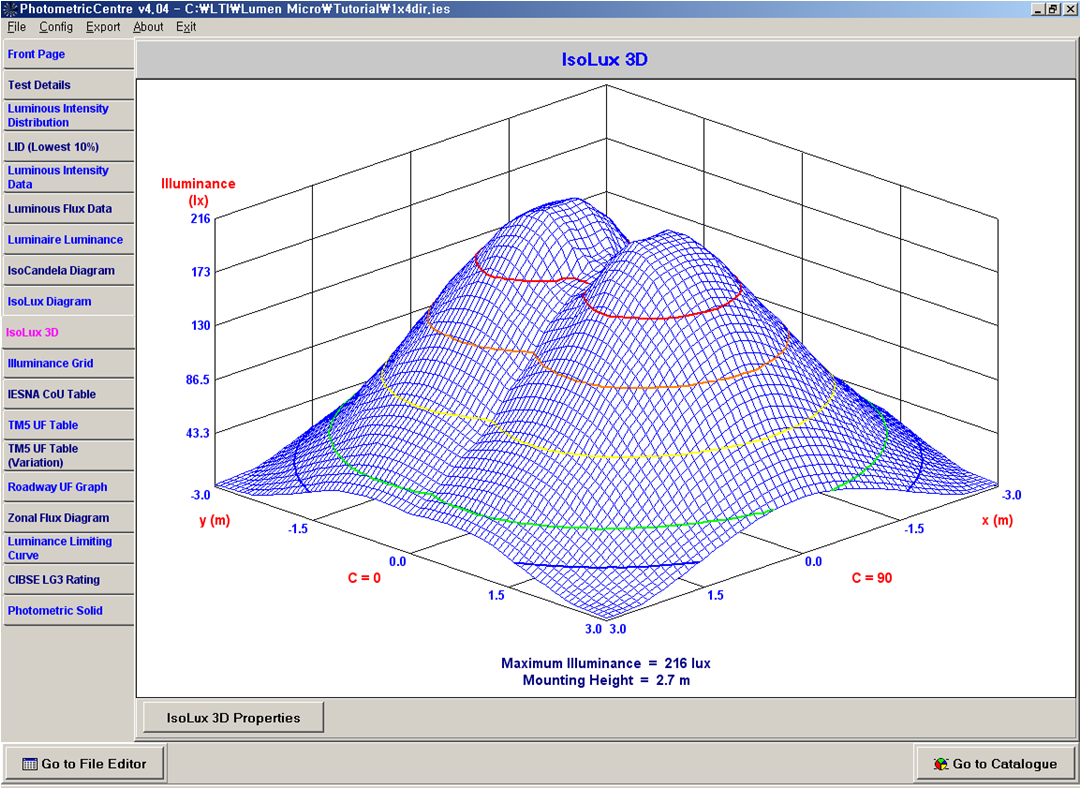
- Iso-Lux Diagrams : 2D or 3D
- Illuminance Grid - 20 × 20 illuminance table
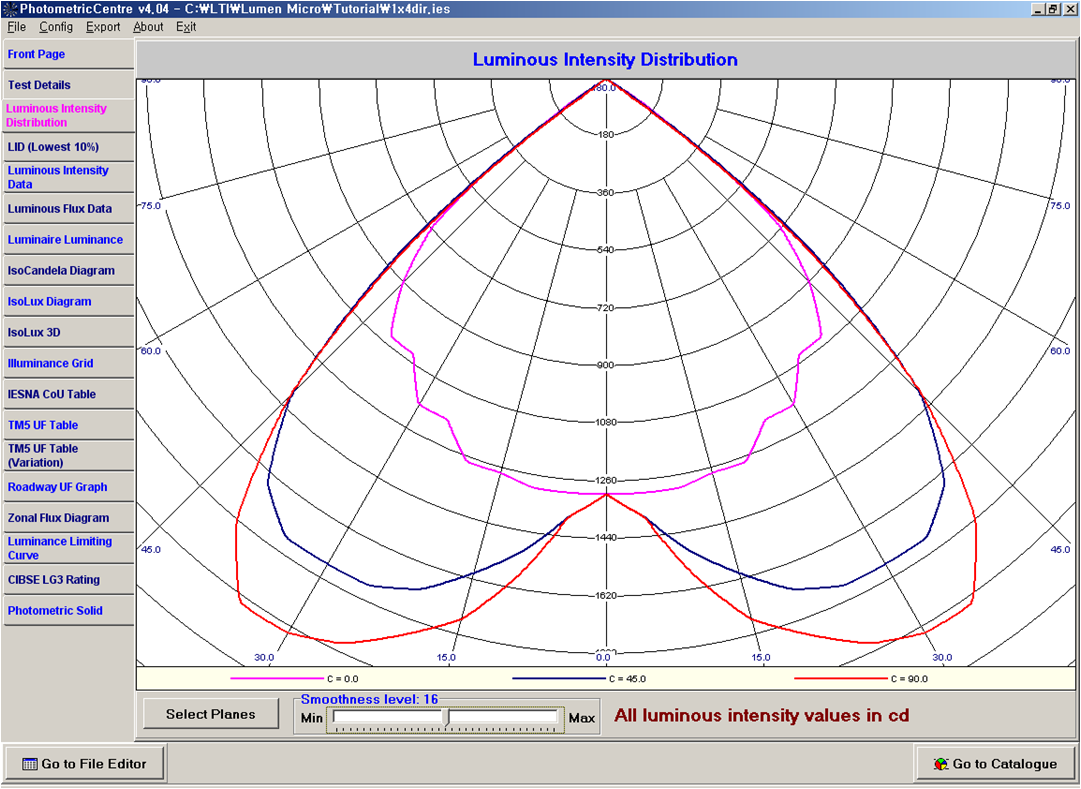
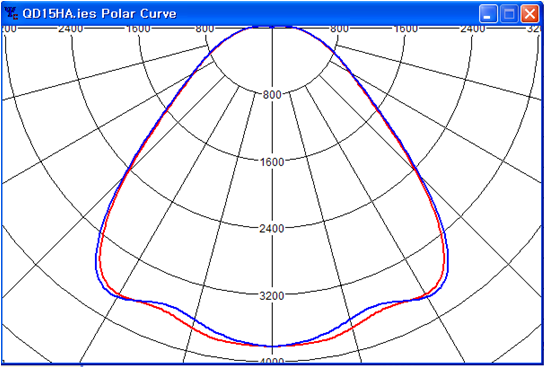
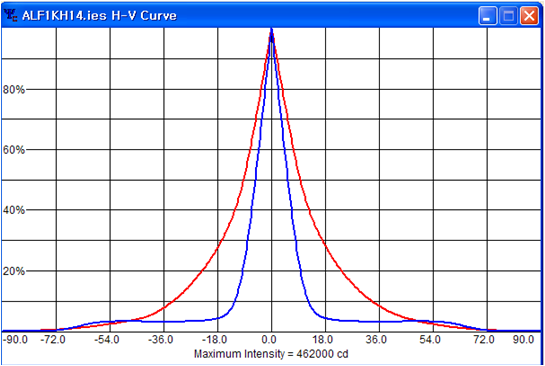
- Color polar or H-V luminous intensity distribution ( LID ) plot
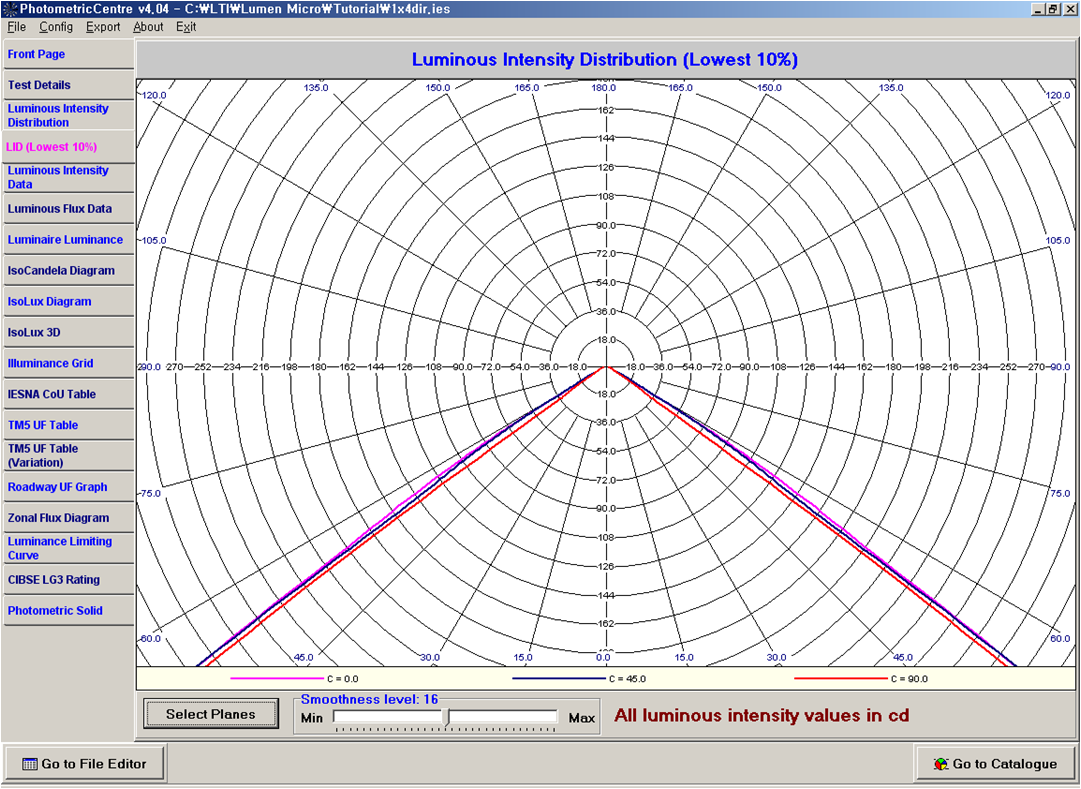
- LID 10%
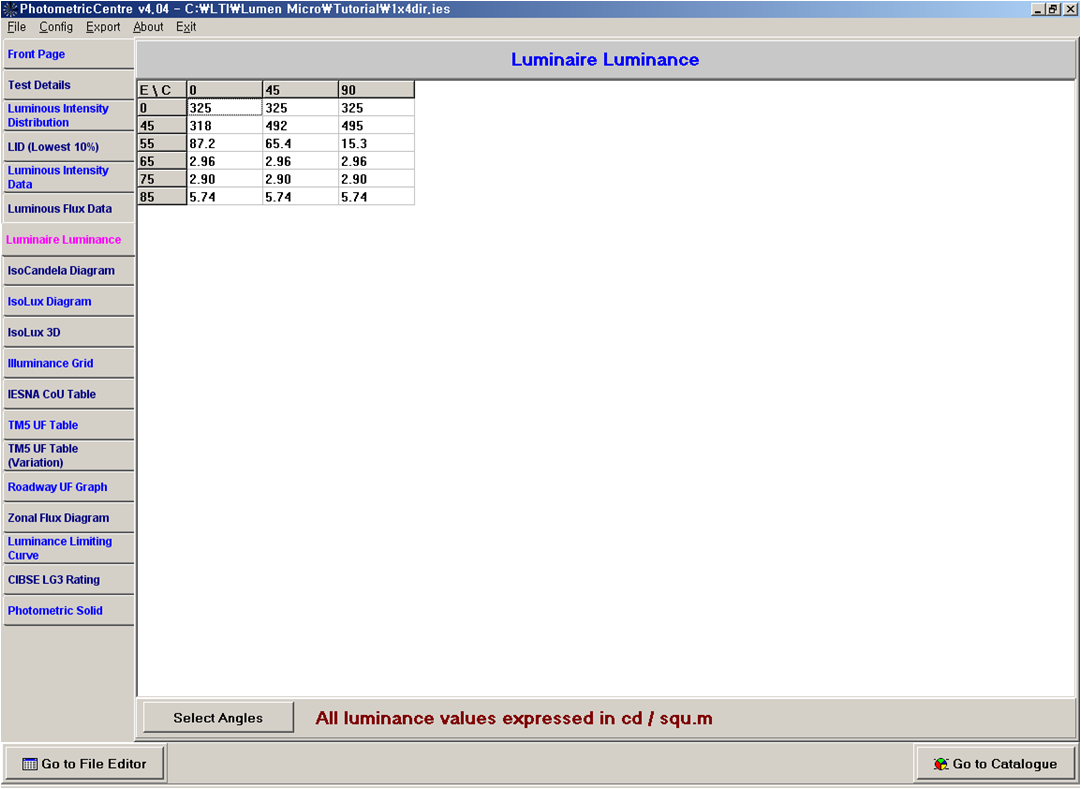
- Luminance table
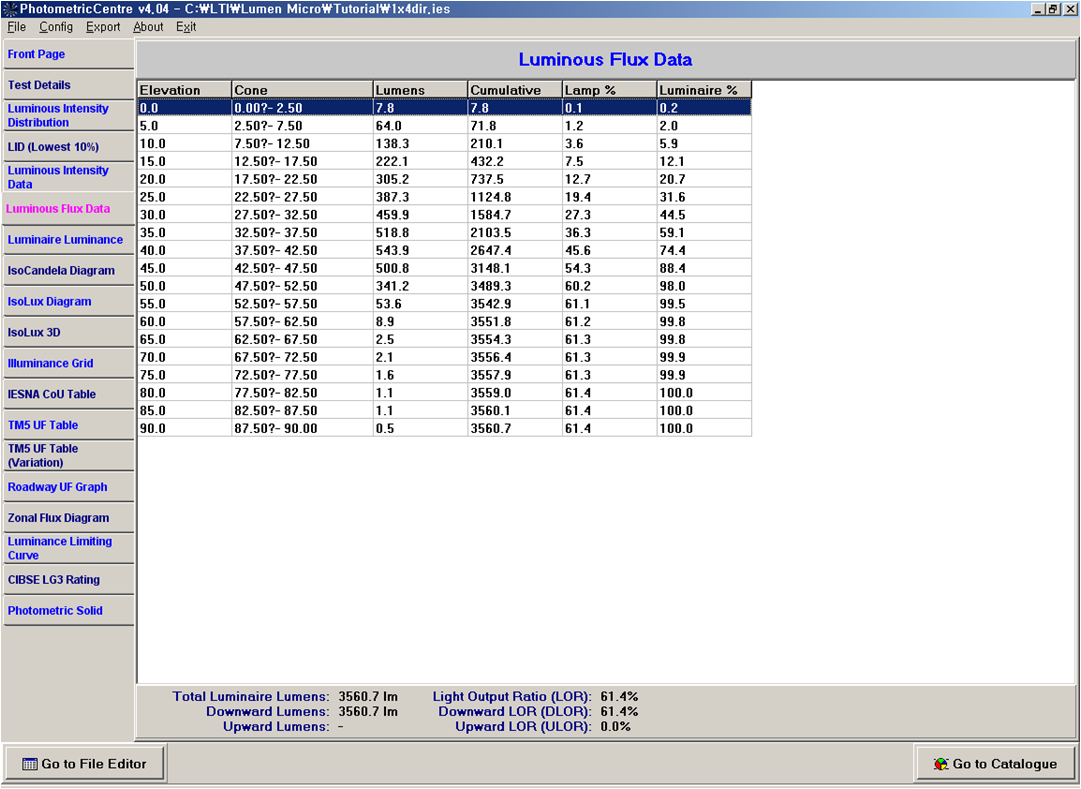
- Luminous flux table
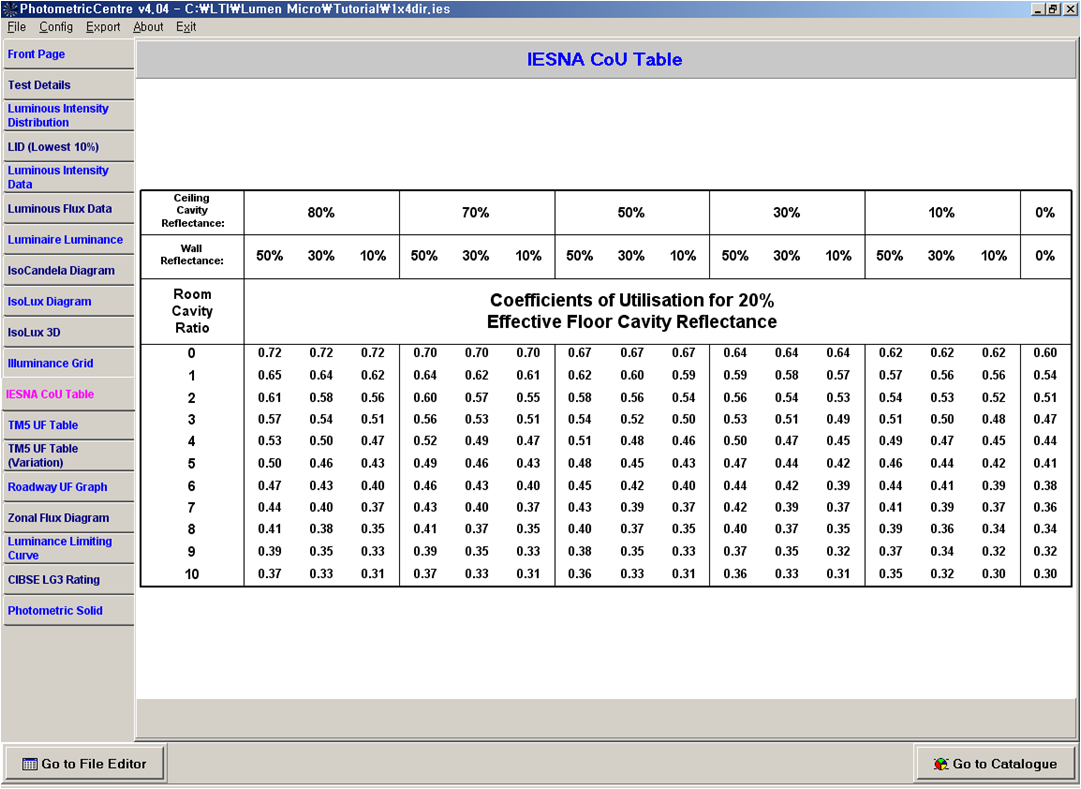
- IESNA Coefficient of Utilisation table
- CIBSE TM5 Utilication table
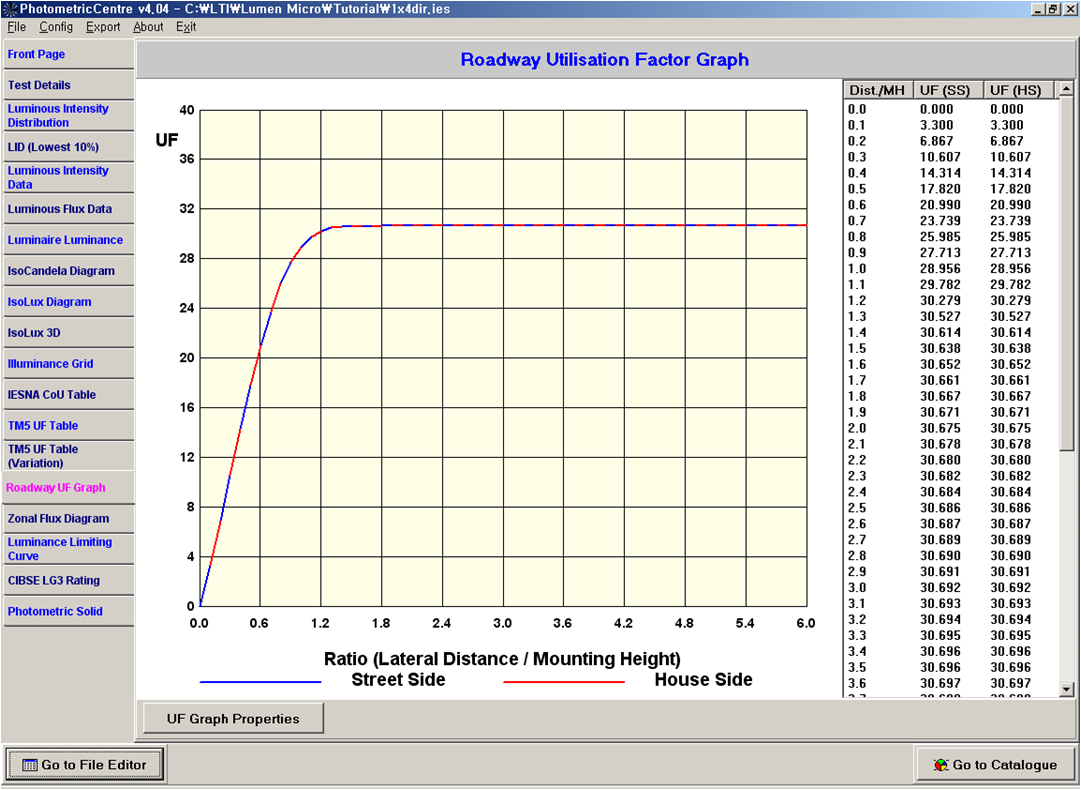
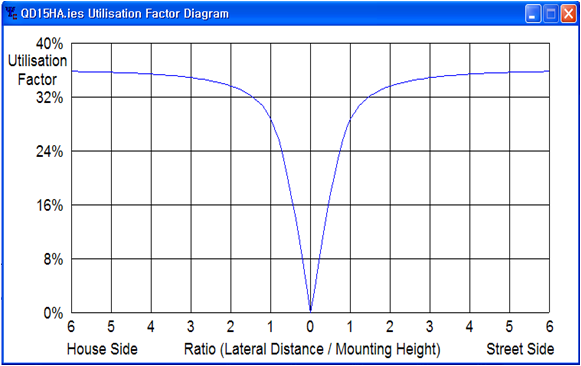
- Utilication Factor diagram
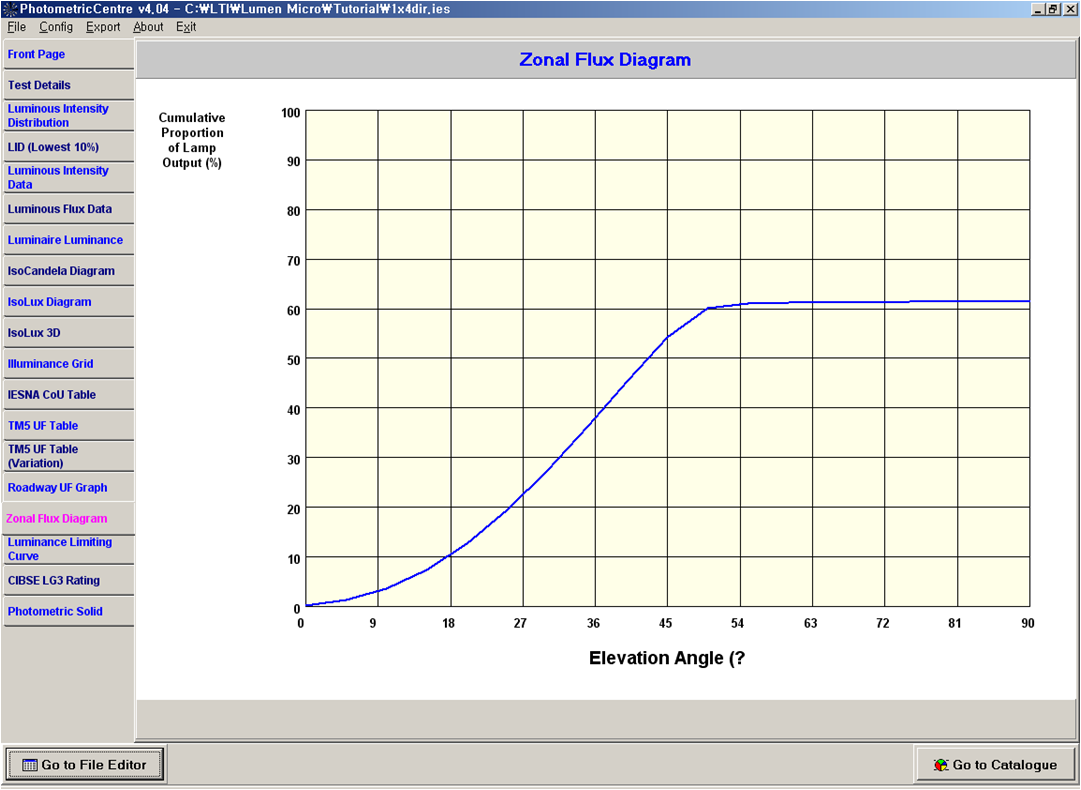
- Zonal flux diagram
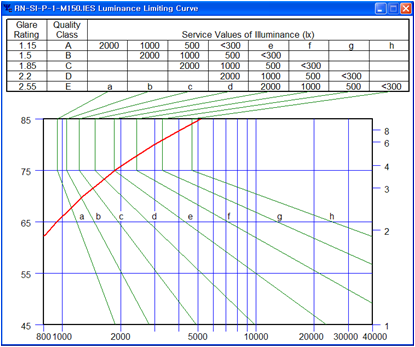
- Luminance Limiting curve
- Lumen Pie Chart (BUG rating)

Photometric Catalogue (조명관련 Diagram 생성)
- Iso-Candela diagrams
- Iso-lux and illuminance grayscale diagrams
- LID Polar and H-V plots
- Cone lux levels
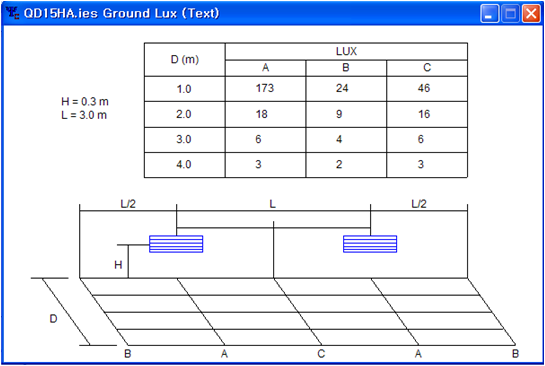
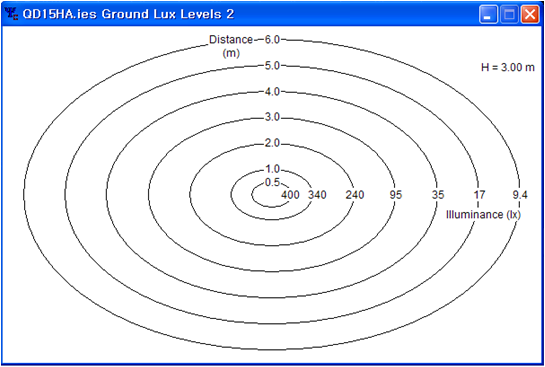
- Ground lux levels
- Floor lux levels for Drive-over luminaires
- Illumination diagrams


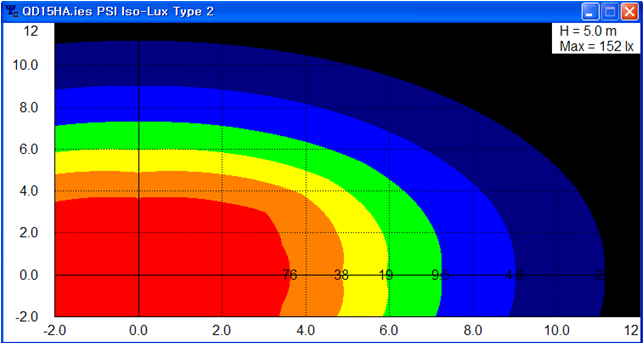
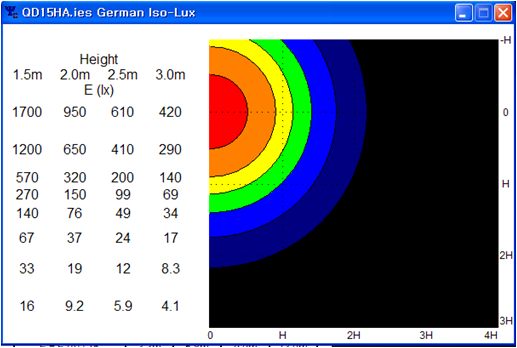
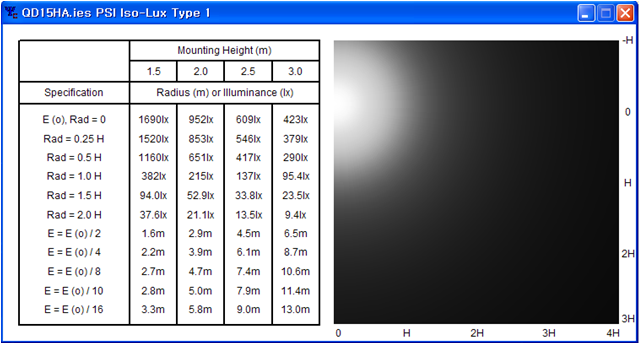
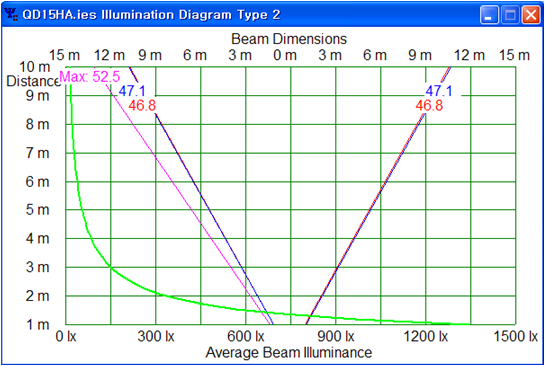
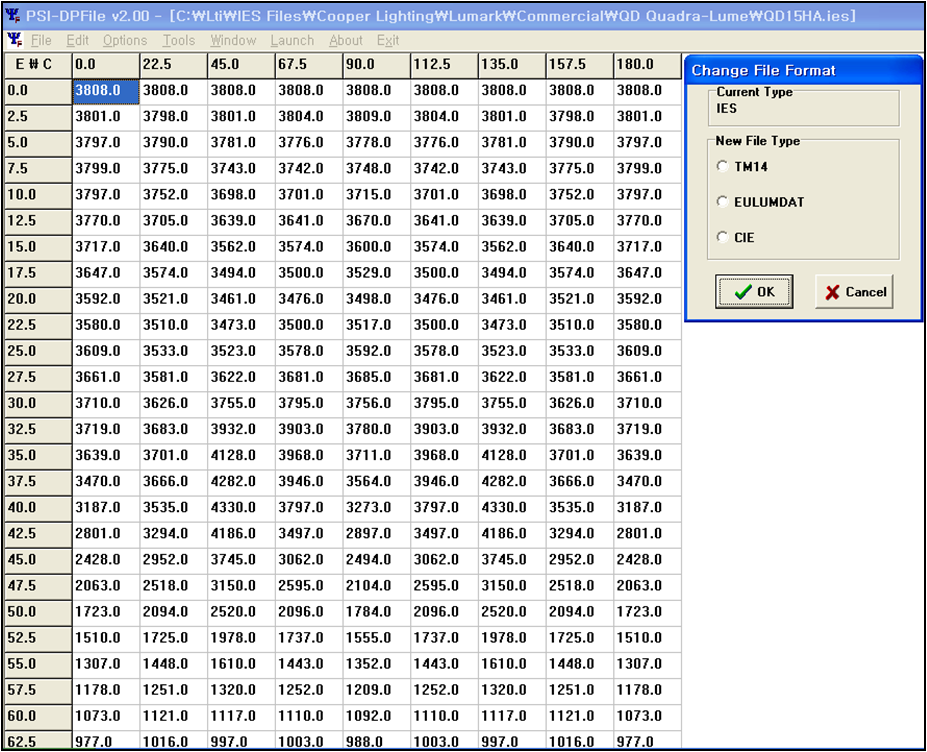
Photometric File Editor (배광데이터 파일 유틸리티)
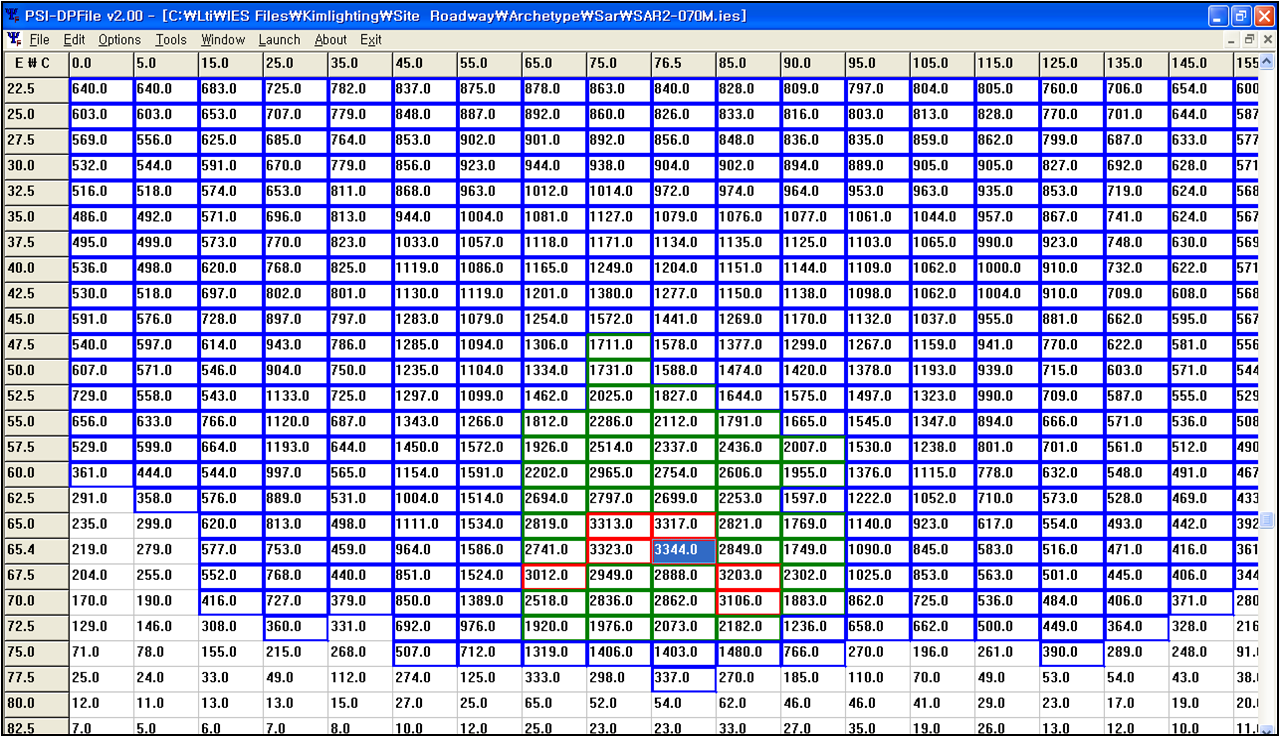
- IES File Candela data 편집
- Data를 Cut, Copy, Paste 할 수 있음
- Apply mathematical functions to the data
- Locate maximum function
- Photometric Center 또는 Photometric Catalogue Launch
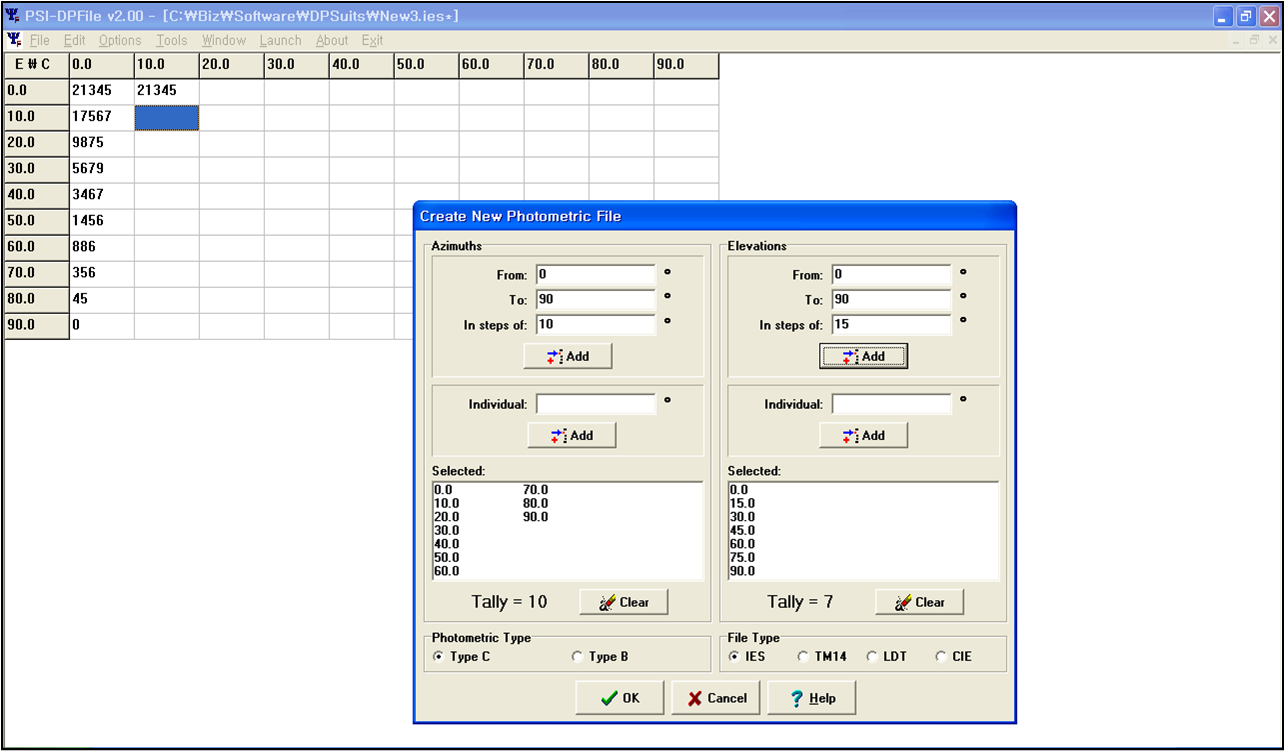
- IES File의 생성
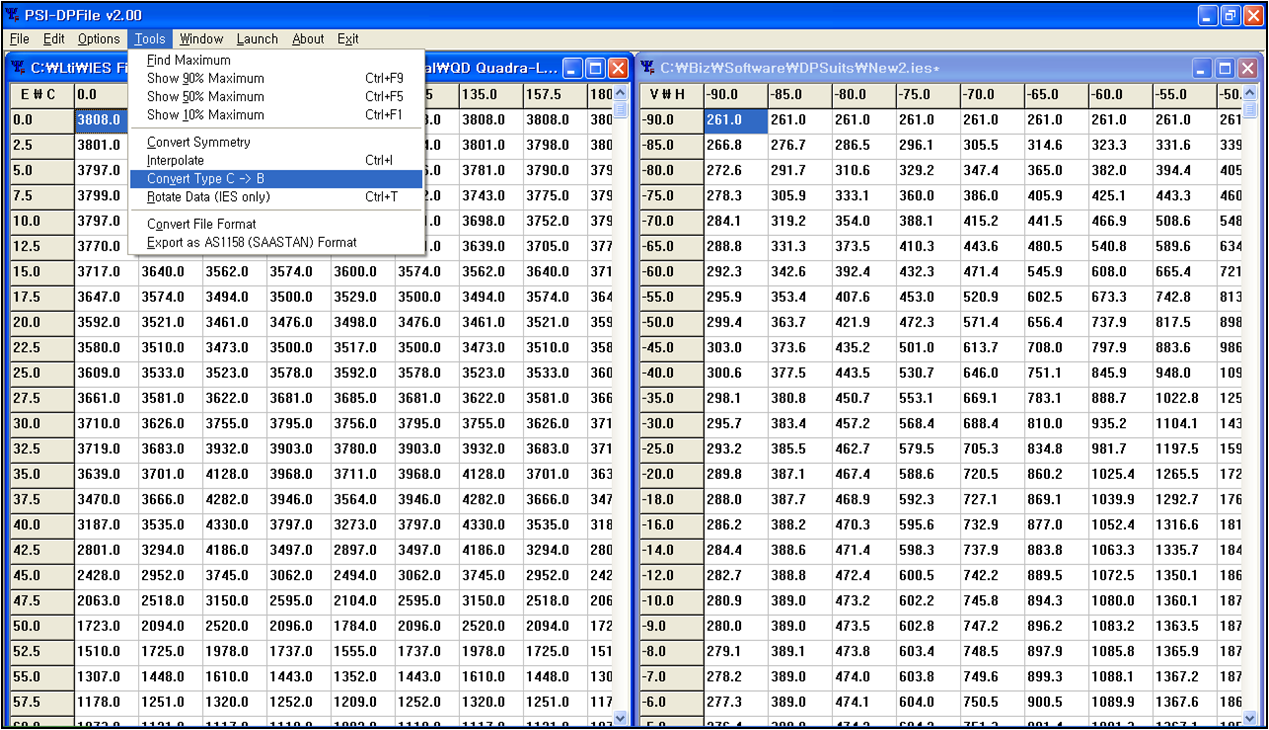
- IES파일의 Type C Photometry를 Type B Photometry로 변환
- 등기구의 대칭성 변환
- 최대값의 100%, 90%, 50%, 10%를 자동 표시
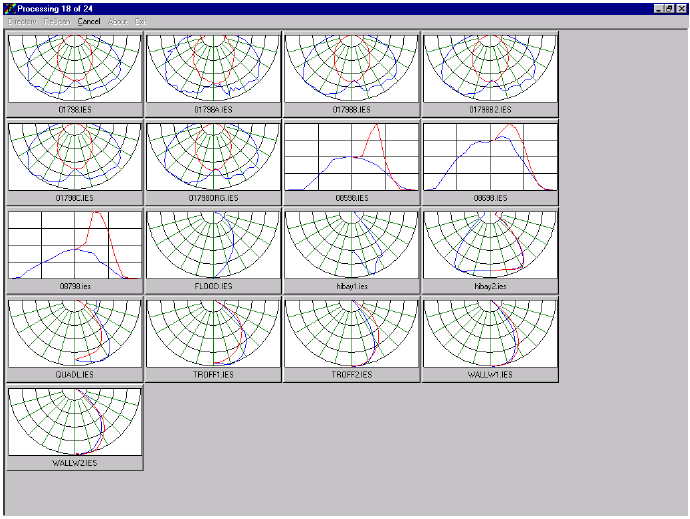
Photometric Browse (배광데이터 파일 비교)
- 여러 등기구의 배광 분포를 한 Window 내에서 비교
- 서로 다른 제조사의 등기구의 배광을 비교
- 미세한배광의 차이를 식별 가능
